
There are key differences between the traction phase and the growth phase of a company. Understanding what stage you are at, helps you focus on the right goals, metrics, channels, and team structure. But how do you know when you are ready to transition from one phase to the other?
My guess is most of you are screaming “when you reach product market fit!” True, but knowing you have reached product/market fit typically isn’t a clean cut answer. It is a line that is always moving.
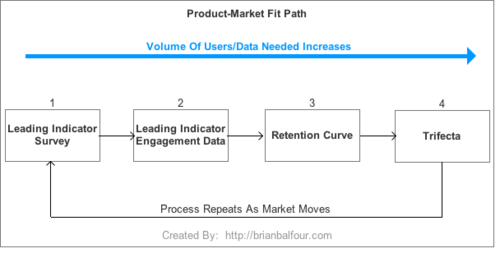
Instead of thinking about product/market fit as a definitive point on the startup path, I think about it as a series of tests and check points that increase in difficulty, but also in definitiveness. Knowing where you are along this path also helps you understand when to go from traction, to transition, to growth.
Here are the product-market fit check points:

1. The Leading Indicator Survey
The most popular and familiar product market fit test is one of two surveys:
1a. Product/Market Fit Survey (Created by Sean Ellis)
This survey asks the question:
“How would you feel if you could no longer use [product]?” The measure of success is if 40% or more respond “Very Disappointed.”
1b. NPS (Net Promoter Score)
Net Promoter Score is a method to measure customer happiness and has been used by many companies as an indicator of growth. Read more about how to measure NPS here There are tools such as Wootric to help you measure and monitor very easily.
While surveys are useful, I would much rather take bets on what people are doing, not what they say they would do or are doing. This is why I think about these surveys more of as a leading indicator of product market fit vs proof of product market fit.
Out of the 4 check points, the leading indicator surveys are easy to deploy and require the least amount of data. As a result they are the quickest method to getting data around product/market fit before waiting the time it takes to measure the next three check points on my list.
On the other hand, there are two big negatives of the leading indicator surveys:
a. They have the highest chance for generating a false positive
b. It is hard to answer the question “how big of a market?” with this data and therefore hard to understand how much you should accelerate.
For these two reasons I’d be cautious about stepping on the gas until you can support the survey results with one of the next two things on my list.
2. Leading Indicator Engagement Data
The leading indicator survey data tells you what people say they would do (i.e. be very disappointed if the product disappeared) so the next step is to support that with data about what they are actually doing. That comes with engagement data (typically at a small scale) that tells a story that the user is getting meaningful value out of the product.
For a photo sharing app, that might be the number of photos users are sharing on a daily or weekly basis. For a messaging app, that might be how many unique people users are messaging per day. For a B2B SaaS app that helps you with invoicing, the engagement data might be around how many invoices processed per company.
This data must align with:
a. Events or actions, not views
b. The core purpose of the product
There are two faults with this data.
1. It is probably at a small scale.
2. It is easy to rationalize. In other words, look for the data that supports what you want, rather than an unbiased view.
This is why I view this type of data as a potential leading indicator of product market fit, but won’t call the fight until steps 3 and 4.
3. The Retention Curve
The third check point on the product-market fit path is the retention curve. Plot the % active over time (for various cohorts) to create your retention curve. IF it flattens off at some point, you have probably found product market fit for some market or audience.

The question then becomes what/who is that market? And how big is it? This is the first check point where you can start to get a better understanding of those two questions.
Identify the characteristics of those that retained vs those that didn’t. If you don’t know the difference, then you don’t know who your audience and market is.
There are two basic methods to differentiate those who retain vs those who don’t. The first is by segmenting the retention curve. Three segments I always do:
a. Key Demographics (Sex, Age, Location, Industry, Company Size, etc depending on the type of product)
b. Time
c. User Source
Then there a number of custom segments you will want to do depending on what type of business/product you have.
The second method is by using qualitative surveys to try and identify differences between those who retained and those who didn’t.
The con with using retention curves is that it takes time to collect retention data. B2C companies like messaging, gaming, and photos have the quickest time to understanding retention. The unit of time on the x-axis is typically days. Transactional or seasonal B2C companies like HotelTonight take longer. B2B SaaS companies take the longest as they are typically measured on monthly churn.
The bottom line, with out retention, accelerating growth is meaningless. Your retention curve is the best proof.
4. The Trifecta
An early advisor of SnapChat once told me a story. About a few months after launch SnapChat had about 200K downloads, 100K daily active users, and those 100K DAU’s were sending on average 1 Million pictures a day (10/DAU).
Product/market fit? Hell yes!!!
Snapchat had the trifecta.
1. Non-Trivial Top Line Growth(Snapchat - 200K downloads)
2. Retention (50% of downloads were active Daily)
3. Meaningful Usage (The users just weren’t coming back daily, but there were taking a meaningful action - sending 10 pictures a day on average)
In my opinion, when and only when you have these three things can you say with close to 100% certainty you have product market fit among a meaningful market.
If you are lucky (like SnapChat), product-market fit will just smack you in your face and say “I’m HERE!!!! ” No leading indicator surveys, retention curves, or complicated metrics needed. It is just there. If you find yourself in this situation, take a moment to do your happy dance (because this rarely happens), and fast forward from the traction phase to the growth phase.
The problem? This just doesn’t happen often out of the gate. It typically takes time to get to these type of metrics and you need other indicators that you are on the right path. That is where steps 1 - 3 come in.
It Never Ends
This process never ends primarily for one reason - your market doesn’t sit still. It is always moving. These days markets are moving/changing at an accelerating pace. As your market moves, your product needs to move with it making product/market fit a pulse that you need to constantly keep your thumb on. Additionally, in the effort to maintain growth, companies tend to expand their target audiences to new segments causing the need to step through this process again.
Fortunately for startups large companies lose sight of this never ending process. They either don’t move with the market. Or as they expand their target audience they assume product market fit, and end up pushing a product that ultimately fails. This creates opportunity for disruption and startups.
Volume Of Data and Users
As you progress through these checkpoints the volume of users and data needed increases. As Rob Go of NextView Ventures points out, it is not an either or answer between PMF or Growth. It is a progressing balance of each.
When To Go From Traction To Transition To Growth
So at what points on this path do you move between the phases of traction, transition, and growth? The exact point is different for different startups. But here are the most common points IMO:

Traction —> Transition
I would typically recommend you start going from Traction to Transition after having step #1 and #2. You should start ramping up the top of the funnel to gather the volume of data needed for retention curves and to discover your growth levers.
Transition —> Growth
This inflection point typically happens near reaching the trifecta. This means expanding the growth team, lengthening payback period, and stepping on the gas.
Subscribe to my email list for exclusive in-depth content about growth. Follow me on Twitter (@bbalfour) for more fun reading on growth.

Comments